Shape functions and basis functions in FEM
1 Lagrange polynomials as shape functions on reference cells
| (%i1) | kill(all)$ |
| (%i6) |
load("eigen")$ load("fem.mac")$ load("draw")$ load("color_map.mac")$ load("mnewton")$ load("tex_format.mac")$ |
| (%i12) |
fig_size : [1280,1024]$ wxplot_size : fig_size$ fig_font : "Helvetica"$ fig_font_size : 20$ wxanimate_autoplay : false$ wxanimate_framerate : 1$ |
1.1 1D
| (%i13) | reference_cell_1d : [0, 1]$ |
| (%i14) | support_points_1d : GenLagrangeNodes1D(3, reference_cell_1d); |
\[\operatorname{(support\_ points\_ 1d) }\left[ 0\operatorname{,}\frac{1}{3}\operatorname{,}\frac{2}{3}\operatorname{,}1\right] \]
| (%i16) |
shape_functions_1d : GenLagrangeBases1D(3, reference_cell_1d, 'ξ)$ PrintEquationList(shape_functions_1d); |
\[\]\[-\frac{9 \left( \xi -1\right) \, \left( \xi -\frac{2}{3}\right) \, \left( \xi -\frac{1}{3}\right) }{2} \]\[\frac{27 \left( \xi -1\right) \, \left( \xi -\frac{2}{3}\right) \xi }{2} \]\[-\frac{27 \left( \xi -1\right) \, \left( \xi -\frac{1}{3}\right) \xi }{2} \]\[\frac{9 \left( \xi -\frac{2}{3}\right) \, \left( \xi -\frac{1}{3}\right) \xi }{2}\]
| (%i17) |
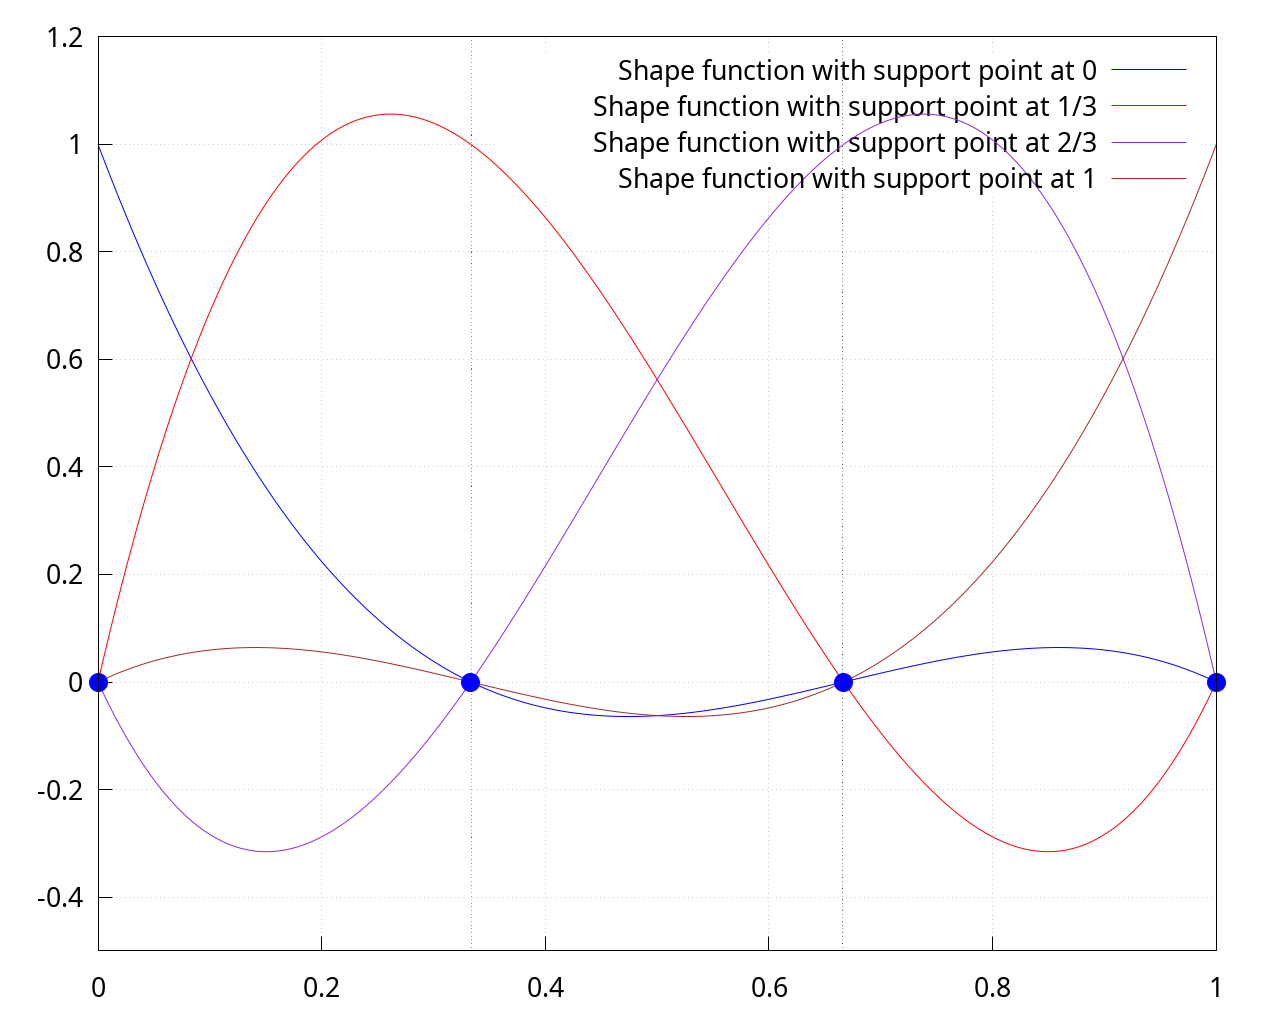
wxdraw2d(grid=true, xrange=reference_cell_1d, yrange=[-0.5, 1.2], dimensions=fig_size, terminal=wxt, font=font_name, font_size=fig_font_size, color=clist[1], key="Shape function with support point at 0", explicit(shape_functions_1d[1], ξ, reference_cell_1d[1], reference_cell_1d[2]), color=clist[2], key="Shape function with support point at 1/3", explicit(shape_functions_1d[2], ξ, reference_cell_1d[1], reference_cell_1d[2]), color=clist[3], key="Shape function with support point at 2/3", explicit(shape_functions_1d[3], ξ, reference_cell_1d[1], reference_cell_1d[2]), color=clist[4], key="Shape function with support point at 1", explicit(shape_functions_1d[4], ξ, reference_cell_1d[1], reference_cell_1d[2]), color=black, line_type = dots, key="", implicit(x=support_points_1d[2], x, 0, 1, y, -0.5, 1.2), color=black, line_type = dots, key="", implicit(x=support_points_1d[3], x, 0, 1, y, -0.5, 1.2), color=blue, point_type=filled_circle, point_size=3, points(makelist([support_points_1d[i],0], i, 1, 4)) ); |
1.2 2D
| (%i18) | support_points_2d : GenLagrangeNodes2D([2, 2], reference_cell_1d, reference_cell_1d); |
\[\operatorname{(support\_ points\_ 2d) }\begin{pmatrix}0 & 0\\ \frac{1}{2} & 0\\ 1 & 0\\ 0 & \frac{1}{2}\\ \frac{1}{2} & \frac{1}{2}\\ 1 & \frac{1}{2}\\ 0 & 1\\ \frac{1}{2} & 1\\ 1 & 1\end{pmatrix}\]
| (%i20) |
shape_functions_2d : GenLagrangeBases2D([2, 2], reference_cell_1d, reference_cell_1d, '[ξ, η])$ PrintEquationList(shape_functions_2d); |
\[\]\[4 \left( \eta -1\right) \, \left( \eta -\frac{1}{2}\right) \, \left( \xi -1\right) \, \left( \xi -\frac{1}{2}\right) \]\[-8 \left( \eta -1\right) \, \left( \eta -\frac{1}{2}\right) \, \left( \xi -1\right) \xi \]\[4 \left( \eta -1\right) \, \left( \eta -\frac{1}{2}\right) \, \left( \xi -\frac{1}{2}\right) \xi \]\[-8 \left( \eta -1\right) \eta \, \left( \xi -1\right) \, \left( \xi -\frac{1}{2}\right) \]\[16 \left( \eta -1\right) \eta \, \left( \xi -1\right) \xi \]\[-8 \left( \eta -1\right) \eta \, \left( \xi -\frac{1}{2}\right) \xi \]\[4 \left( \eta -\frac{1}{2}\right) \eta \, \left( \xi -1\right) \, \left( \xi -\frac{1}{2}\right) \]\[-8 \left( \eta -\frac{1}{2}\right) \eta \, \left( \xi -1\right) \xi \]\[4 \left( \eta -\frac{1}{2}\right) \eta \, \left( \xi -\frac{1}{2}\right) \xi \]
| (%i30) |
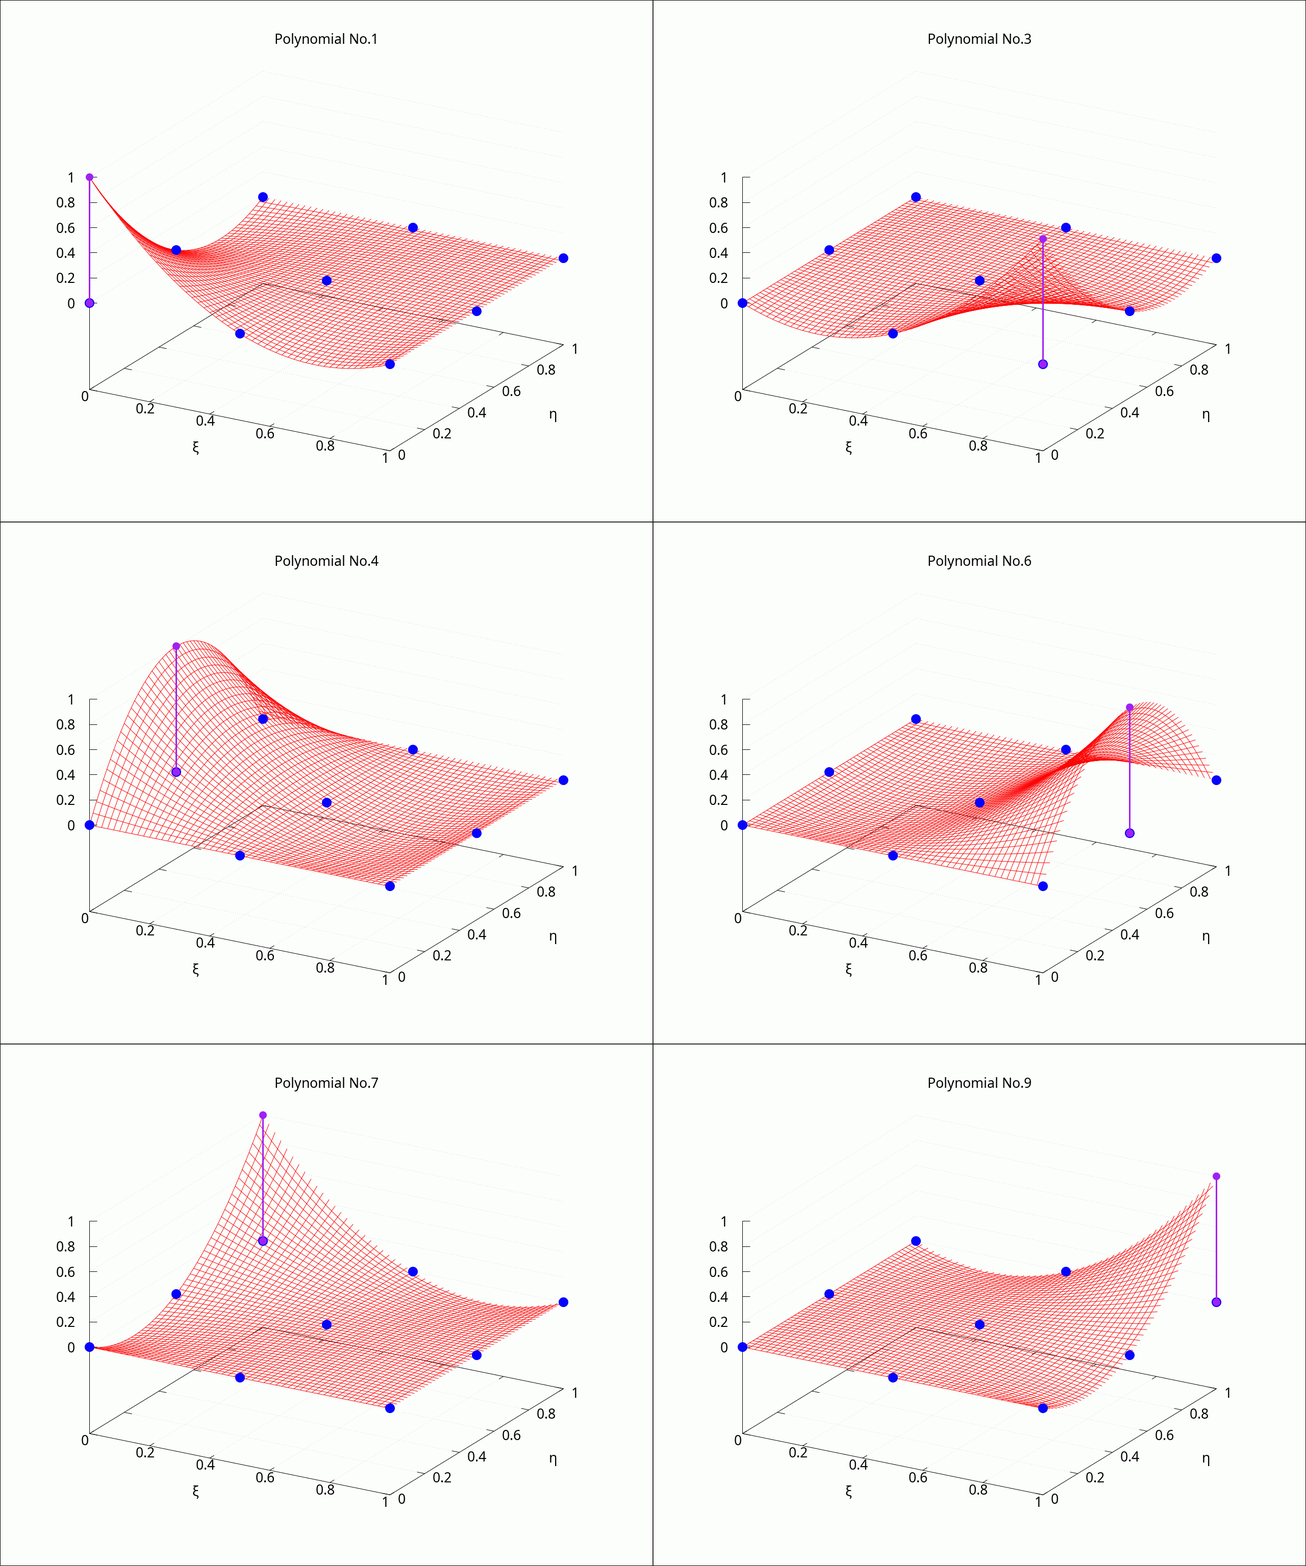
with_slider_draw3d(i, linspace(1, length(shape_functions_2d), length(shape_functions_2d)), grid=true, enhanced3d=false, color=red, dimensions=fig_size, font=font_name, font_size=fig_font_size, title=sconcat("Polynomial No.", i), xlabel="ξ", ylabel="η", transparent=true, explicit(shape_functions_2d[i], ξ, 0, 1, η, 0, 1), color=blue, point_type=filled_circle, point_size=3, enhanced3d=false, points(makelist([support_points_2d[p,1], support_points_2d[p,2], 0], p, 1, 9)), points_joined=true, line_type=solid, color=purple, line_width=3, point_size=2, points([[support_points_2d[i,1], support_points_2d[i,2], 0], [support_points_2d[i,1], support_points_2d[i,2], 1]]) ); |
2 Map from reference cell to real cell
2.1 1D
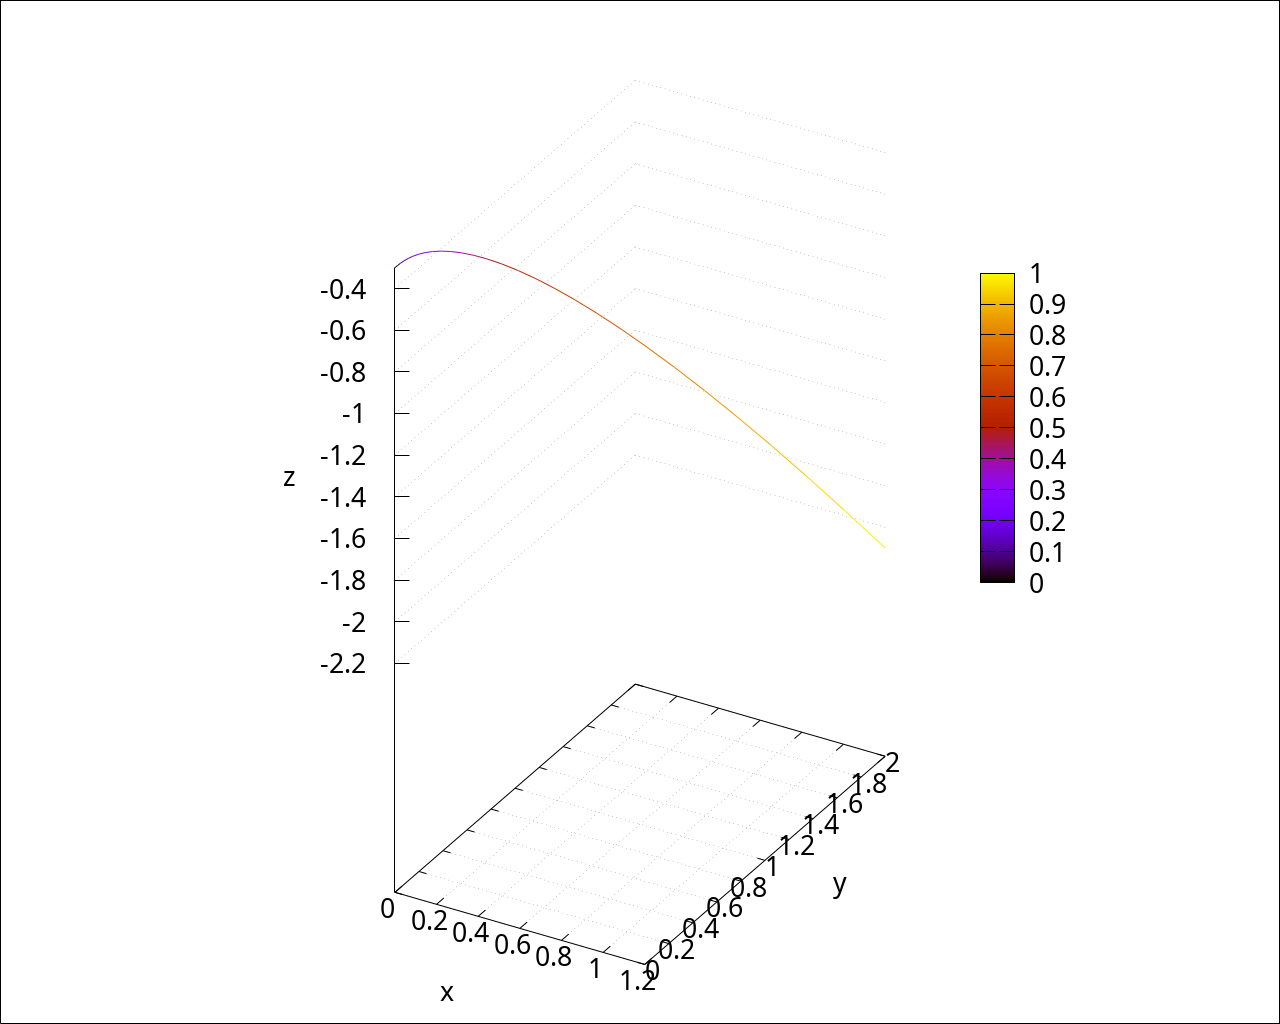
| --> | curve(ξ) := [1.2 * ξ^3, 1.5 * ξ^2 + 0.5 * ξ, -2 * ξ^3 - 0.3]; |
\[\operatorname{ }\operatorname{curve}\left( \xi \right) \operatorname{:=}\left[ 1.2 {{\xi }^{3}}\operatorname{,}1.5 {{\xi }^{2}}+0.5 \xi \operatorname{,}\left( -2\right) {{\xi }^{3}}-0.3\right] \]
| --> |
wxdraw3d(grid=true, dimensions=fig_size, terminal=wxt, font=font_name, font_size=fig_font_size, proportional_axes=xyz, xlabel="x", ylabel="y", zlabel="z", enhanced3d=[ξ, ξ], parametric(curve(ξ)[1], curve(ξ)[2], curve(ξ)[3], ξ, 0, 1) ); |
| --> |
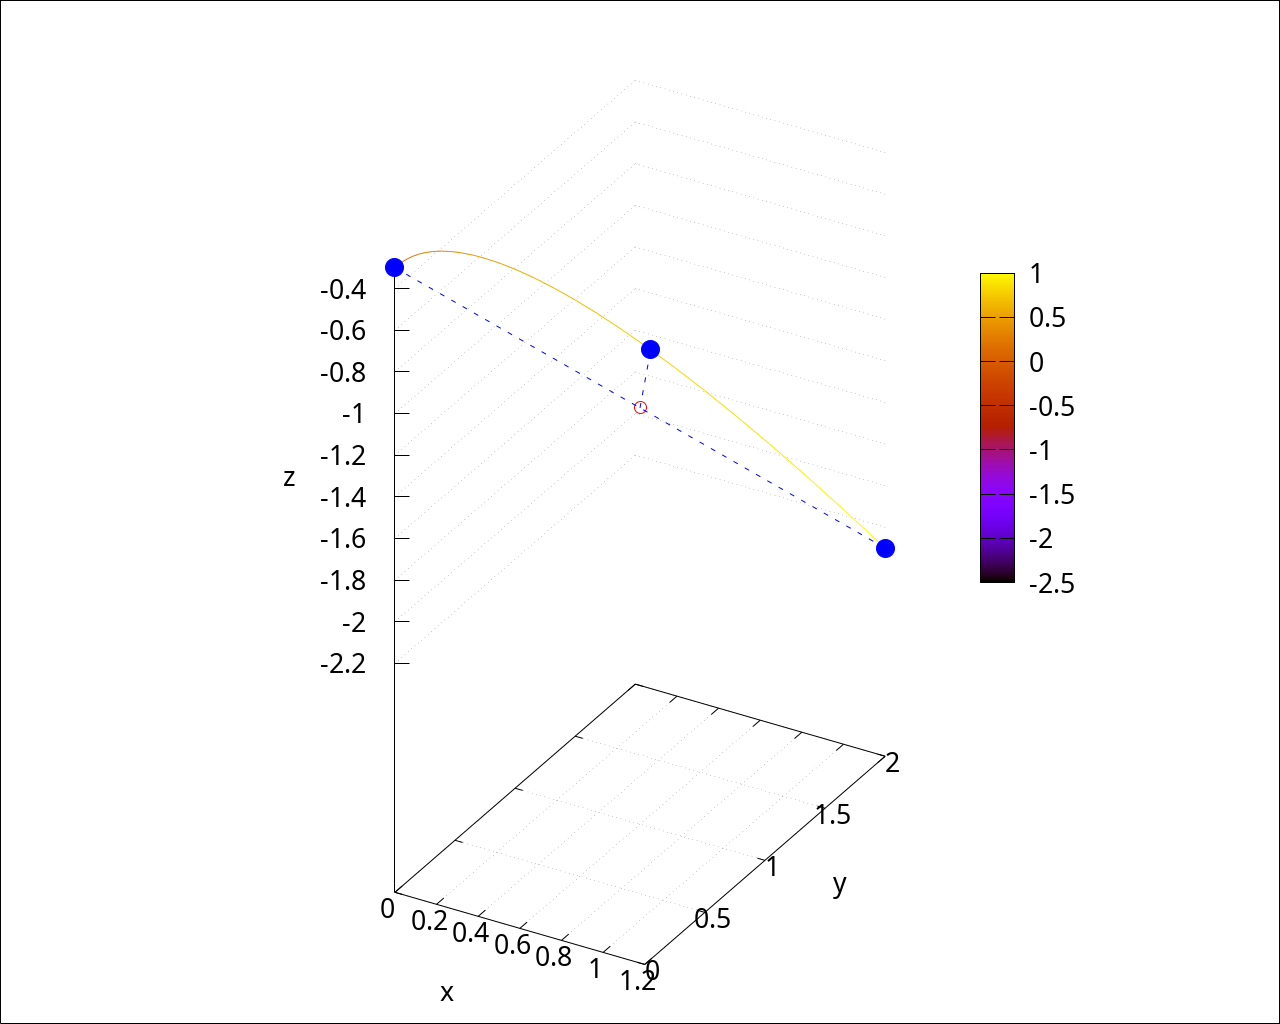
p1 : curve(0); p2 : curve(1); |
\[\operatorname{(p1) }\left[ 0\operatorname{,}0\operatorname{,}-0.3\right] \]
\[\operatorname{(p2) }\left[ 1.2\operatorname{,}2.0\operatorname{,}-2.3\right] \]
| --> | p_middle : 0.5 * p1 + 0.5 * p2; |
\[\operatorname{(p\_ middle) }\left[ 0.6\operatorname{,}1.0\operatorname{,}-1.3\right] \]
| --> | ξ0 : 0.5$ |
| --> | curve_tangent(ξ) := subst(x=ξ, diff(curve(x), x)); |
\[\operatorname{ }\operatorname{curve\_ tangent}\left( \xi \right) \operatorname{:=}\operatorname{subst}\left( x=\xi \operatorname{,}\frac{d}{d x} \operatorname{curve}(x)\right) \]
| --> | project_middle_obj : innerproduct((curve(ξ) - p_middle), curve_tangent(ξ)); |
\[\]\[rat: replaced 0.5 by 1/2 = 0.5 \]\[rat: replaced 3.0 by 3/1 = 3.0 \]\[rat: replaced -1.0 by -1/1 = -1.0 \]\[rat: replaced 0.5 by 1/2 = 0.5 \]\[rat: replaced 1.5 by 3/2 = 1.5 \]\[rat: replaced 0.9999999999999998 by 1/1 = 1.0 \]\[rat: replaced 3.6 by 18/5 = 3.6 \]\[rat: replaced -0.6 by -3/5 = -0.6 \]\[rat: replaced 1.2 by 6/5 = 1.2\]
\[\operatorname{(project\_ middle\_ obj) }\frac{1632 {{\xi }^{5}}+450 {{\xi }^{3}}-591 {{\xi }^{2}}-275 \xi -50}{100}\]
| --> | sol : mnewton([project_middle_obj], [ξ], [ξ0]); |
\[\operatorname{(sol) }\left[ \left[ \xi =0.7552127951245737\right] \right] \]
| --> | project_middle : curve(rhs(sol[1][1])); |
\[\operatorname{(project\_ middle) }\left[ 0.5168794478345868\operatorname{,}1.233125946442094\operatorname{,}-1.161465746390978\right] \]
| --> |
wxdraw3d(grid=true, dimensions=fig_size, terminal=wxt, font=font_name, font_size=fig_font_size, proportional_axes=xyz, xlabel="x", ylabel="y", zlabel="z", enhanced3d=[ξ, ξ], parametric(curve(ξ)[1], curve(ξ)[2], curve(ξ)[3], ξ, 0, 1), color=red, point_type=circle, point_size=2, enhanced3d=false, points([p_middle]), color=blue, point_type=filled_circle, point_size=3, enhanced3d=false, points([p1, project_middle, p2]), color=blue, point_type=-1, enhanced3d=false, points_joined=true, line_type=dashes, points([p1, p2]), color=blue, point_type=-1, enhanced3d=false, points_joined=true, line_type=dashes, points([p_middle, project_middle]) ); |
| --> | shape_functions_1d : GenLagrangeBases1D(2, reference_cell_1d, 'ξ); |
\[\operatorname{(shape\_ functions\_ 1d) }\left[ 2 \left( \xi -1\right) \, \left( \xi -\frac{1}{2}\right) \operatorname{,}-4 \left( \xi -1\right) \xi \operatorname{,}2 \left( \xi -\frac{1}{2}\right) \xi \right] \]
| --> |
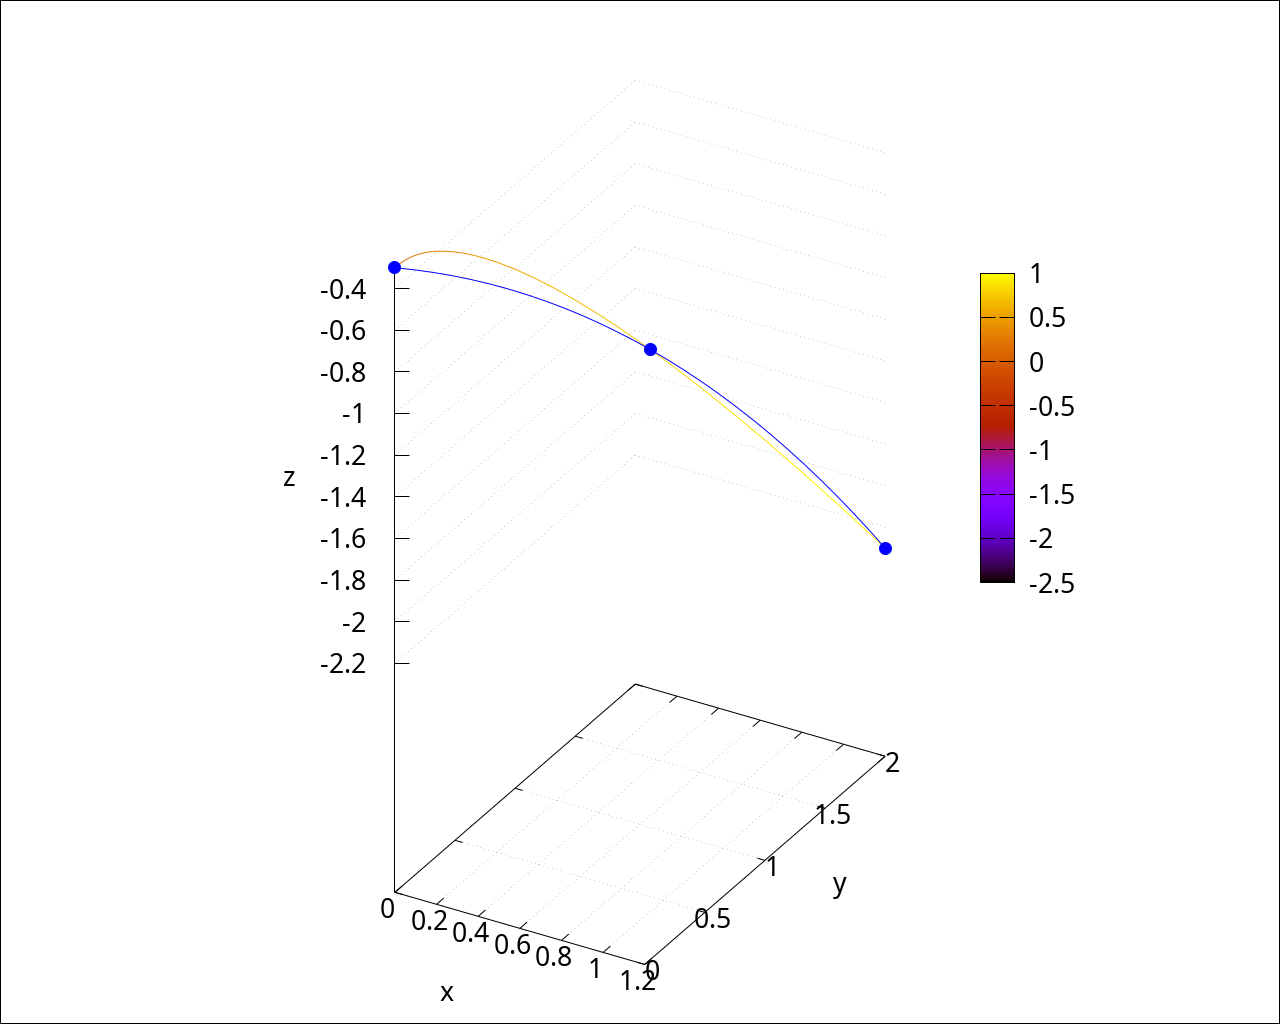
map_from_ref_to_real_1d : p1 * shape_functions_1d[1] + project_middle * shape_functions_1d[2] + p2 * shape_functions_1d[3]$ PrintEquationList(map_from_ref_to_real_1d); |
\[\]\[2.4 \left( \xi -\frac{1}{2}\right) \xi -2.067517791338348 \left( \xi -1\right) \xi \]\[4.0 \left( \xi -\frac{1}{2}\right) \xi -4.932503785768375 \left( \xi -1\right) \xi \]\[-4.6 \left( \xi -\frac{1}{2}\right) \xi +4.645862985563912 \left( \xi -1\right) \xi -0.6 \left( \xi -1\right) \, \left( \xi -\frac{1}{2}\right) \]
| --> |
wxdraw3d(grid=true, dimensions=fig_size, terminal=wxt, font=font_name, font_size=fig_font_size, proportional_axes=xyz, xlabel="x", ylabel="y", zlabel="z", enhanced3d=[ξ, ξ], parametric(curve(ξ)[1], curve(ξ)[2], curve(ξ)[3], ξ, 0, 1), color=blue, enhanced3d=false, parametric(map_from_ref_to_real_1d[1], map_from_ref_to_real_1d[2], map_from_ref_to_real_1d[3], ξ, 0, 1), color=blue, point_type=filled_circle, point_size=2, enhanced3d=false, points([p1, project_middle, p2]) ); |
2.2 2D
3 Basis functions of finite element
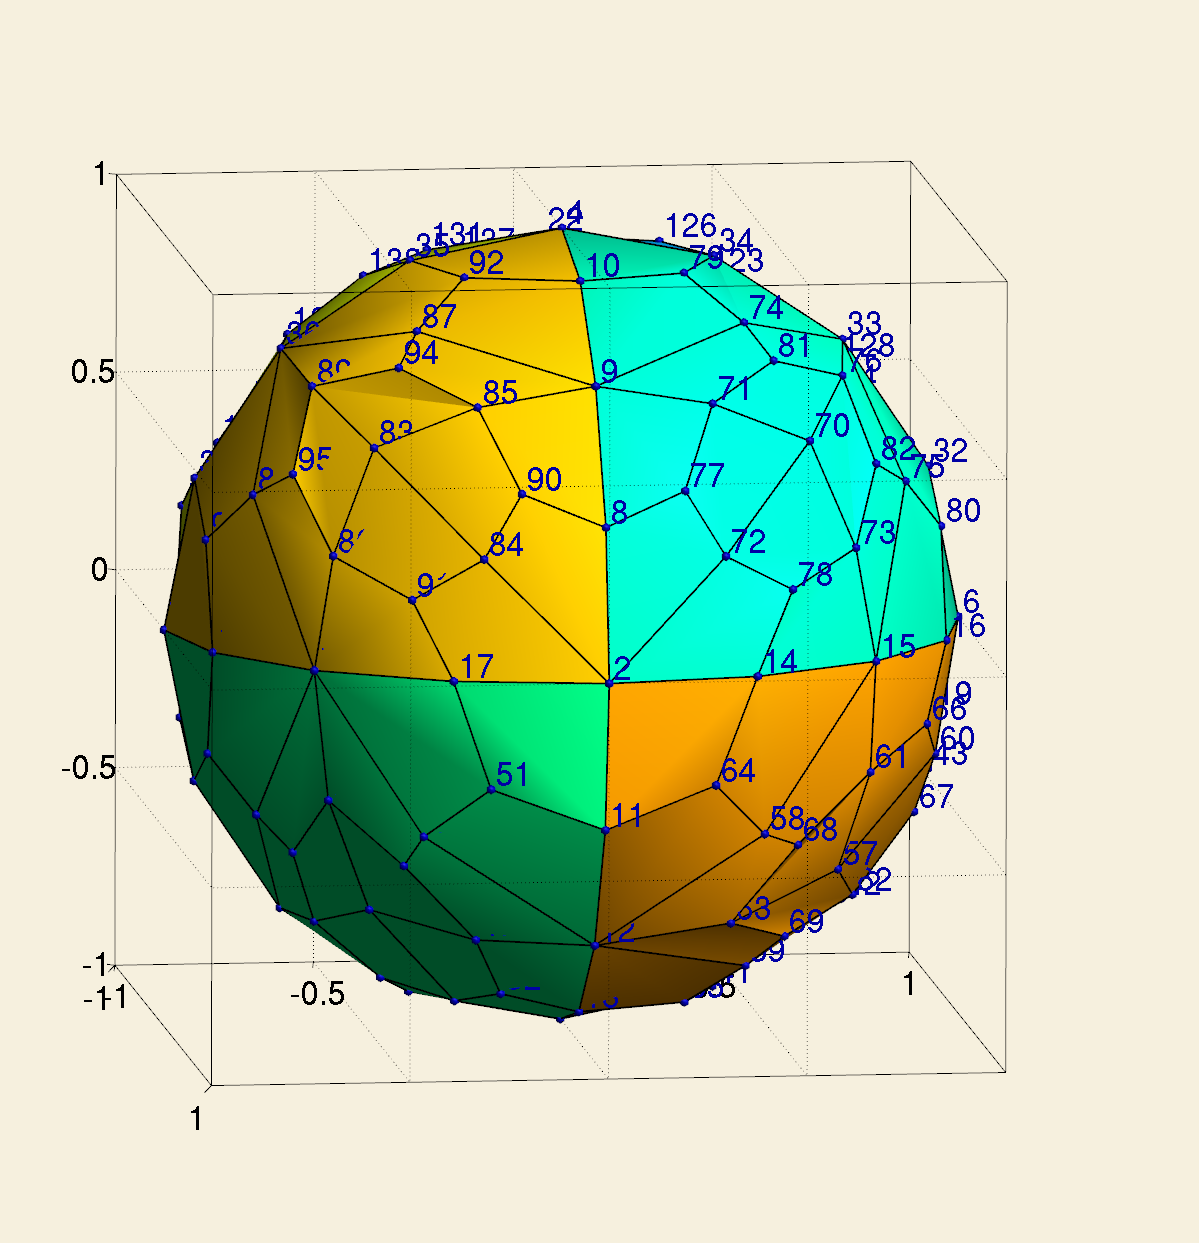
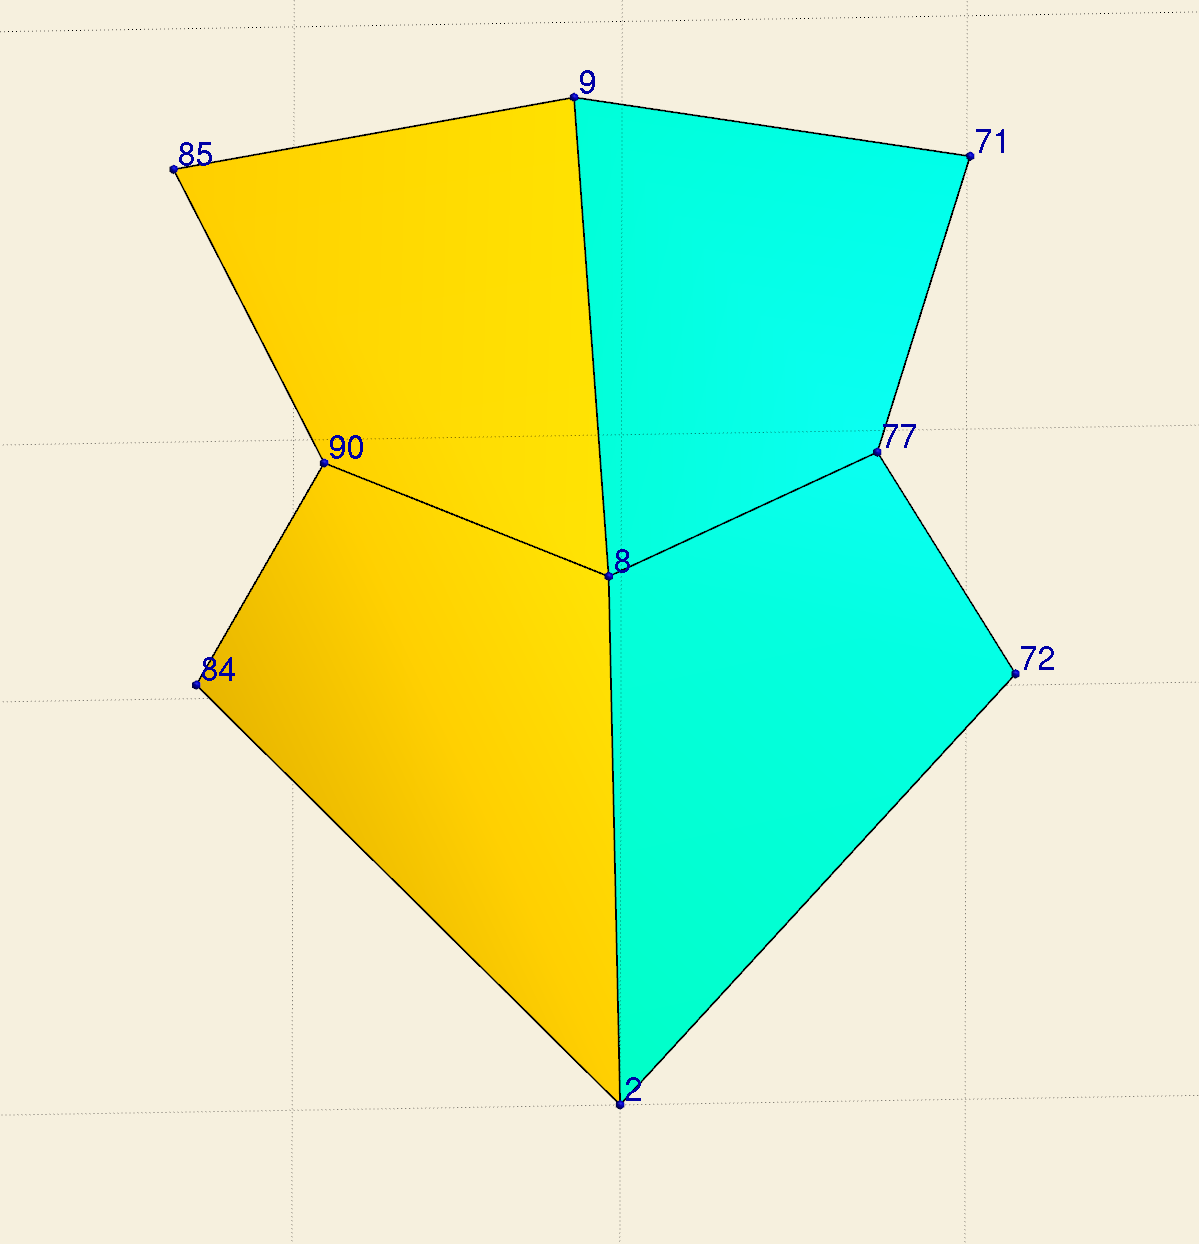
Cell 92: [9 71 77 8]
Cell 94: [8 77 72 2]
Cell 110: [2 84 90 8]
Cell 112: [8 90 85 9]
Cell 92: [9 71 8 77]
Cell 94: [8 77 2 72]
Cell 110: [2 84 8 90]
Cell 112: [8 90 9 85]
Shape function #3 in the reference cell corresponding to cell 92
Shape function #1 in the reference cell corresponding to cell 94
Shape function #3 in the reference cell corresponding to cell 110
Shape function #1 in the reference cell corresponding to cell 112
| --> | node9 : [0, 0.7071067827963321, 0.7071067795767629]$ |
| --> | node71 : [0.2959042210220728, 0.6562956747206669, 0.6940581238803165]$ |
| --> | node77 : [0.2069290967160619, 0.4625779322341045, 0.8620916456748057]$ |
| --> | node8 : [0, 0.382683433164956, 0.9238795321799713]$ |
| --> | node72 : [0.3048963989653106, 0.3017651820890481, 0.903313877219181]$ |
| --> | node2 : [0, 0, 1]$ |
| --> | node84 : [-0.3037257264799272, 0.3035840488652949, 0.9030987810581932]$ |
| --> | node90 : [-0.2041682670359604, 0.461491589969017, 0.8633312406738223]$ |
| --> | node85 : [-0.2959042210220861, 0.6562956747206589, 0.6940581238803184]$ |
| --> |
shape_functions_for_map_2d : GenLagrangeBases2D([1, 1], reference_cell_1d, reference_cell_1d, '[ξ, η]); |
\[\operatorname{(shape\_ functions\_ for\_ map\_ 2d) }\left[ \left( 1-\eta \right) \, \left( 1-\xi \right) \operatorname{,}\left( 1-\eta \right) \xi \operatorname{,}\eta \, \left( 1-\xi \right) \operatorname{,}\eta \xi \right] \]
| --> |
cell92_map : node9 * shape_functions_for_map_2d[1] + node71 * shape_functions_for_map_2d[2] + node8 * shape_functions_for_map_2d[3] + node77 * shape_functions_for_map_2d[4]$ |
| --> |
cell94_map : node8 * shape_functions_for_map_2d[1] + node77 * shape_functions_for_map_2d[2] + node2 * shape_functions_for_map_2d[3] + node72 * shape_functions_for_map_2d[4]$ |
| --> |
cell110_map : node2 * shape_functions_for_map_2d[1] + node84 * shape_functions_for_map_2d[2] + node8 * shape_functions_for_map_2d[3] + node90 * shape_functions_for_map_2d[4]$ |
| --> |
cell112_map : node8 * shape_functions_for_map_2d[1] + node90 * shape_functions_for_map_2d[2] + node9 * shape_functions_for_map_2d[3] + node85 * shape_functions_for_map_2d[4]$ |
| --> | shape_functions_for_finite_element : shape_functions_for_map_2d$ |
| --> |
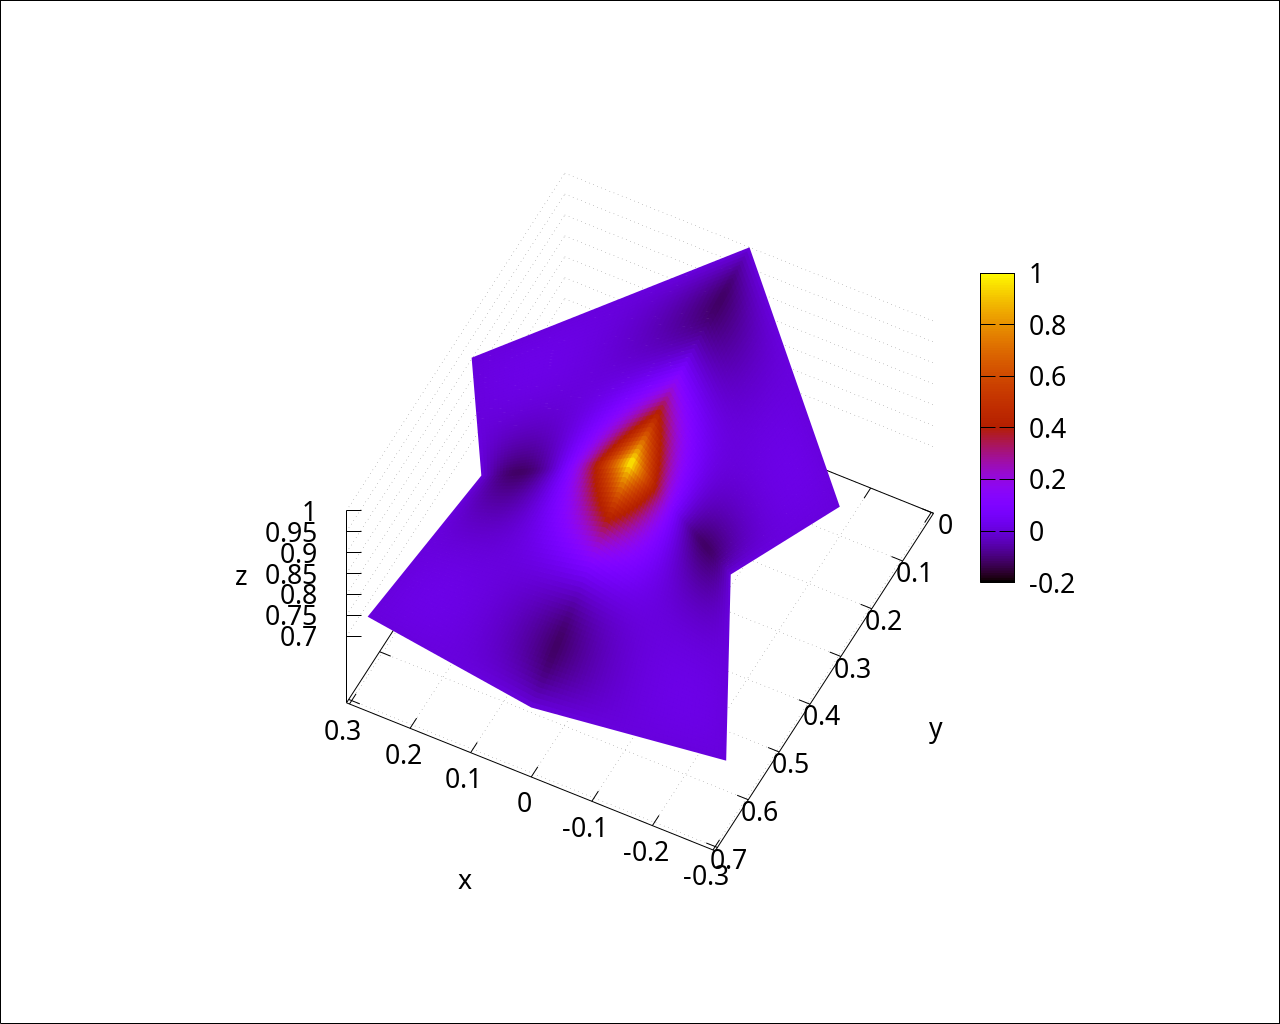
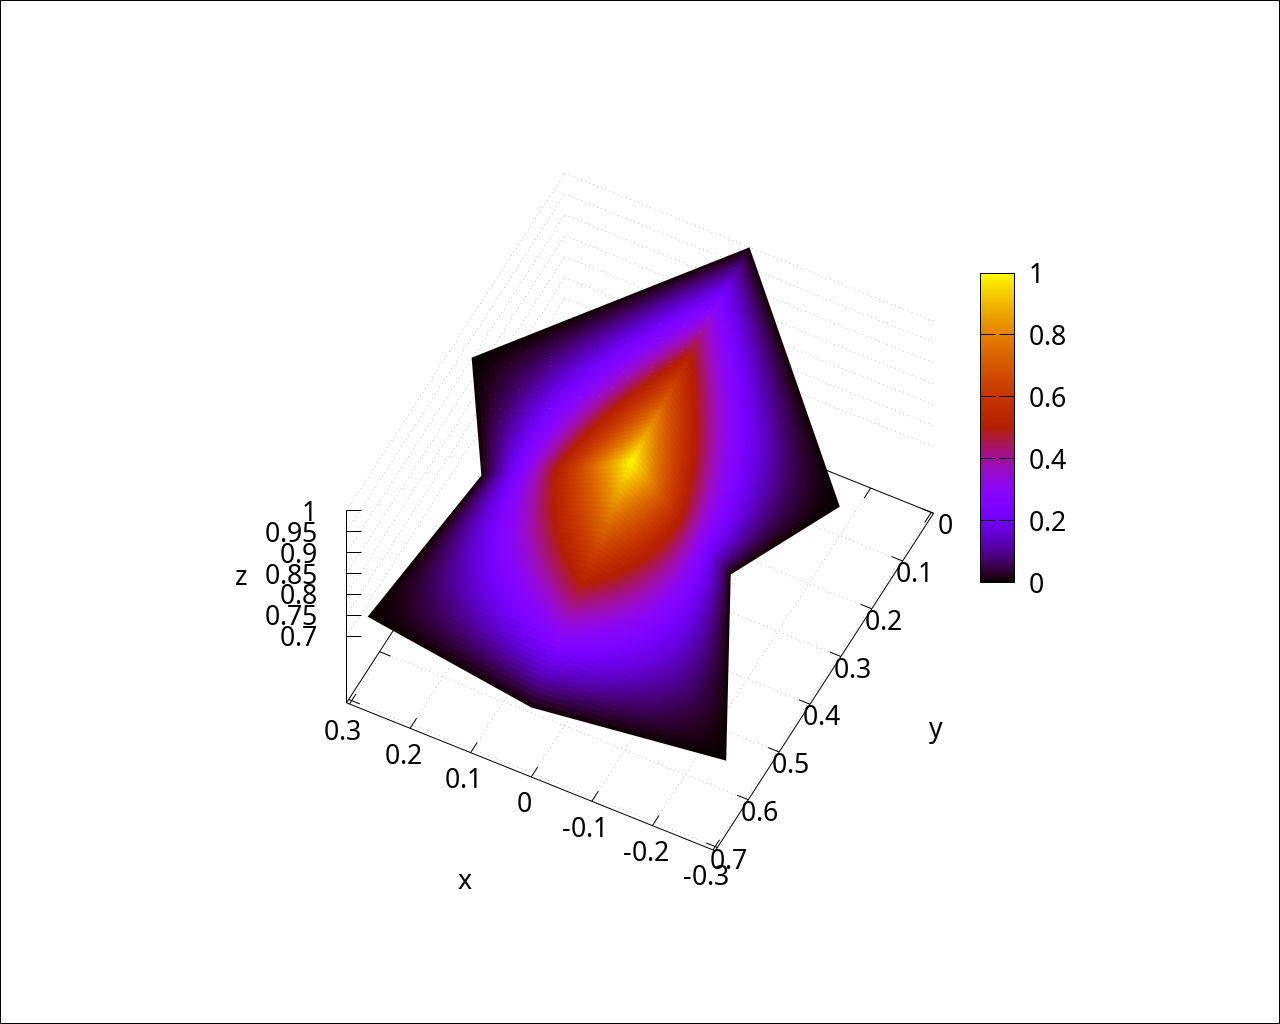
wxdraw3d(grid=true, dimensions=fig_size, terminal=wxt, font=font_name, font_size=fig_font_size, proportional_axes=xyz, xlabel="x", ylabel="y", zlabel="z", view=[38,207], enhanced3d=[shape_functions_for_finite_element[3], ξ, η], parametric_surface(cell92_map[1], cell92_map[2], cell92_map[3], ξ, 0, 1, η, 0, 1), enhanced3d=[shape_functions_for_finite_element[1], ξ, η], parametric_surface(cell94_map[1], cell94_map[2], cell94_map[3], ξ, 0, 1, η, 0, 1), enhanced3d=[shape_functions_for_finite_element[3], ξ, η], parametric_surface(cell110_map[1], cell110_map[2], cell110_map[3], ξ, 0, 1, η, 0, 1), enhanced3d=[shape_functions_for_finite_element[1], ξ, η], parametric_surface(cell112_map[1], cell112_map[2], cell112_map[3], ξ, 0, 1, η, 0, 1) ); |
^
| 7 8 9
| 4 5 6
| 1 2 3
---------->
Shape function #7 in the reference cell corresponding to cell 92
Shape function #1 in the reference cell corresponding to cell 94
Shape function #7 in the reference cell corresponding to cell 110
Shape function #1 in the reference cell corresponding to cell 112
| --> |
shape_functions_for_finite_element : GenLagrangeBases2D([2, 2], reference_cell_1d, reference_cell_1d, '[ξ, η])$ PrintEquationList(shape_functions_for_finite_element); |
\[\]\[4 \left( \eta -1\right) \, \left( \eta -\frac{1}{2}\right) \, \left( \xi -1\right) \, \left( \xi -\frac{1}{2}\right) \]\[-8 \left( \eta -1\right) \, \left( \eta -\frac{1}{2}\right) \, \left( \xi -1\right) \xi \]\[4 \left( \eta -1\right) \, \left( \eta -\frac{1}{2}\right) \, \left( \xi -\frac{1}{2}\right) \xi \]\[-8 \left( \eta -1\right) \eta \, \left( \xi -1\right) \, \left( \xi -\frac{1}{2}\right) \]\[16 \left( \eta -1\right) \eta \, \left( \xi -1\right) \xi \]\[-8 \left( \eta -1\right) \eta \, \left( \xi -\frac{1}{2}\right) \xi \]\[4 \left( \eta -\frac{1}{2}\right) \eta \, \left( \xi -1\right) \, \left( \xi -\frac{1}{2}\right) \]\[-8 \left( \eta -\frac{1}{2}\right) \eta \, \left( \xi -1\right) \xi \]\[4 \left( \eta -\frac{1}{2}\right) \eta \, \left( \xi -\frac{1}{2}\right) \xi \]
| --> |
wxdraw3d(grid=true, dimensions=fig_size, terminal=wxt, font=font_name, font_size=fig_font_size, proportional_axes=xyz, xlabel="x", ylabel="y", zlabel="z", view=[38,207], enhanced3d=[shape_functions_for_finite_element[7], ξ, η], parametric_surface(cell92_map[1], cell92_map[2], cell92_map[3], ξ, 0, 1, η, 0, 1), enhanced3d=[shape_functions_for_finite_element[1], ξ, η], parametric_surface(cell94_map[1], cell94_map[2], cell94_map[3], ξ, 0, 1, η, 0, 1), enhanced3d=[shape_functions_for_finite_element[7], ξ, η], parametric_surface(cell110_map[1], cell110_map[2], cell110_map[3], ξ, 0, 1, η, 0, 1), enhanced3d=[shape_functions_for_finite_element[1], ξ, η], parametric_surface(cell112_map[1], cell112_map[2], cell112_map[3], ξ, 0, 1, η, 0, 1) ); |
