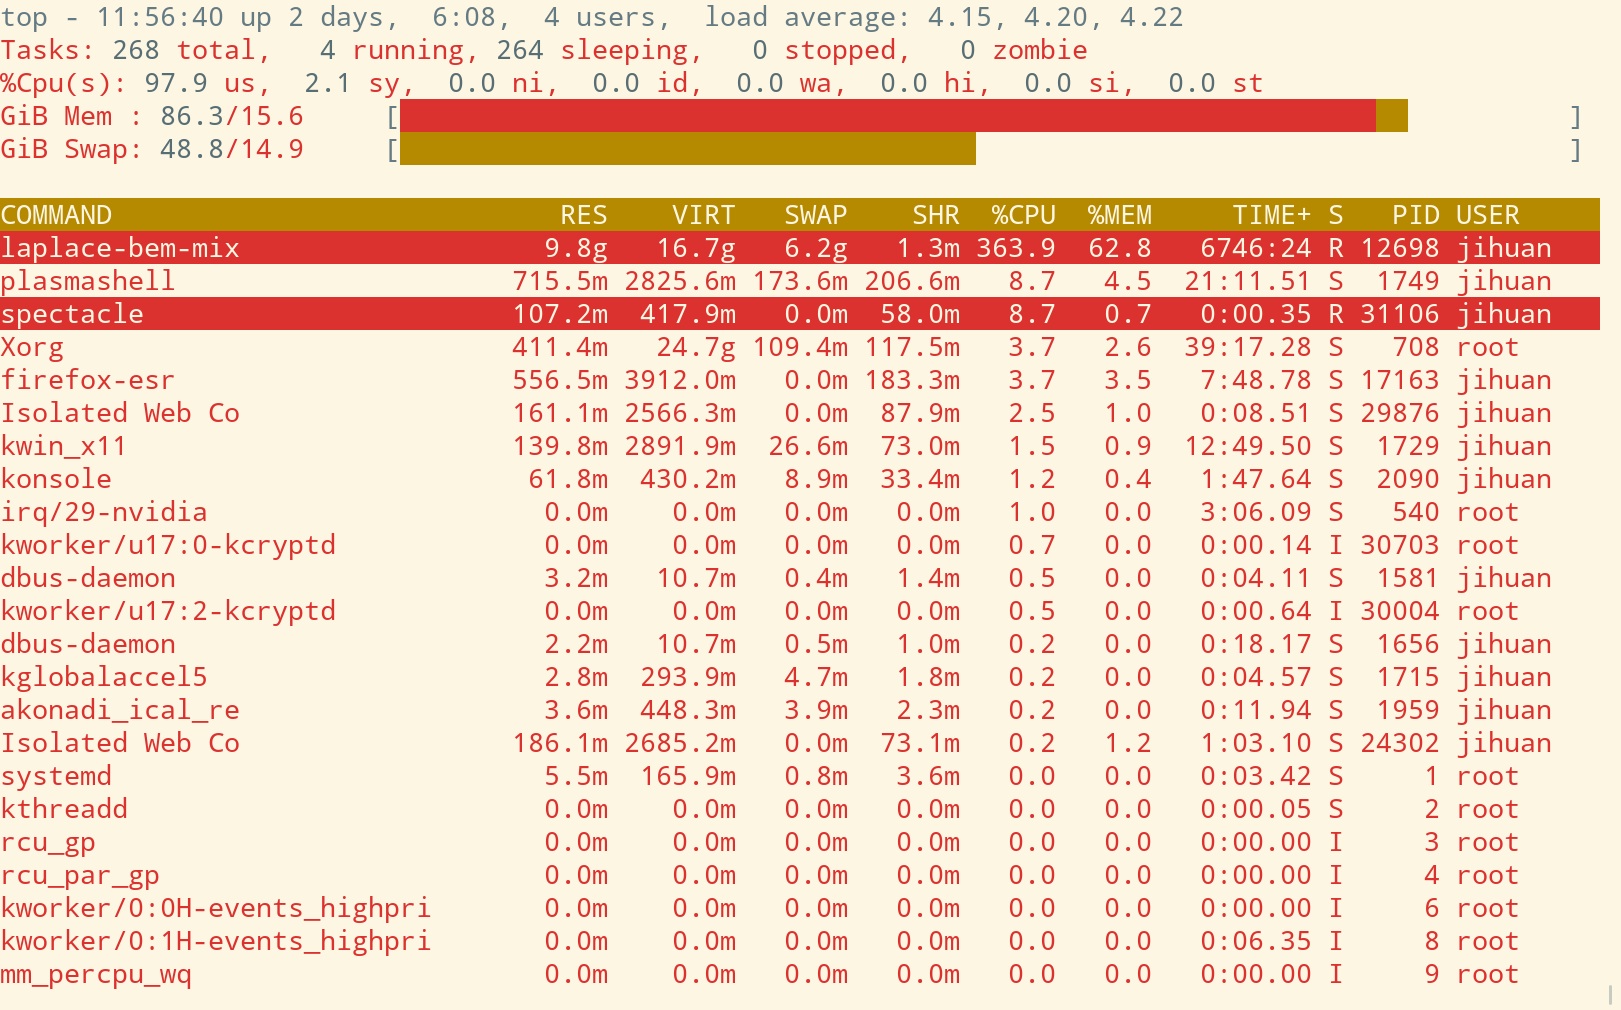
Use top command to monitor process status in Linux

Typical operations
General
s: set the update intervalW: Save the option
Task list manipulation
u: Filter the task list by user name-
o: Filter the task list by entering an expression, such asCOMMAND=... %MEM>10 =: Clear the filter for the task listf: Customize the columns
Visualization effect
z: toggle color and mono modex: highlight the sort field, i.e. the whole corresponding column will be highlighted.y: highlight running tasksb: reverse the highlighting effect for the sorting field and running tasks
Clarification of the time since program start
TIMES+: Total CPU time the task has used since it started. It has the granularity of hundredth of a second, i.e. its accuracy is 1/100 second. Its display format is, for example,6000:25.03, which means 6000 minutes, 25 seconds and 3 hundredths second. Also note that this is the total CPU time. If the process runs in n threads, the actual program execution time is aboutTIMES+/n.TIMES: same asTIMES+but with second accuracy.
N.B. The time in top is the CPU time not the elapsed time. To get the latter, ps command with the option etime should be used instead (reference). The returned result has the date and time format Days-Hours:Minutes:Seconds.
ps -p 12698 -o etime
   ELAPSED
2-03:50:03