Close Qt figure window in Octave
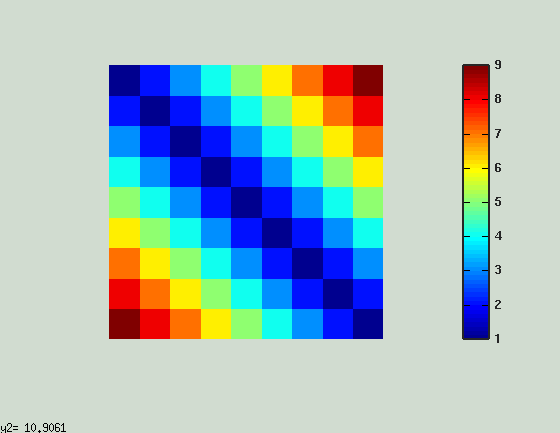
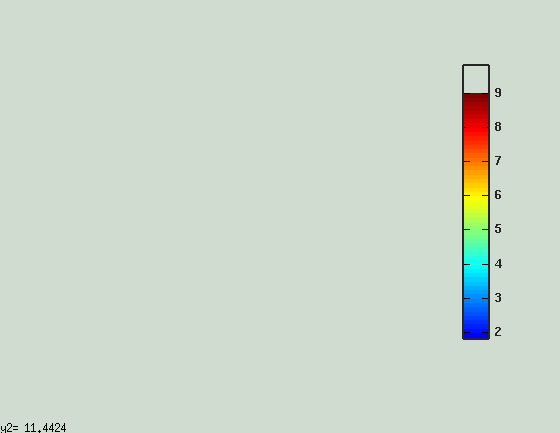
Several graphics toolkits, such as fltk, gnuplot and qt, are provided by GNU Octave to render the figures plot for mathematical functions and data. Even though the classical gnuplot toolkit (usually combined with the x11 terminal) is stable and enough for common visualization tasks, the graphics made within the axe in a figure window cannot be correctly zoomed in or out in some situations, for example, when it is placed in a subplot or when a color bar exists.

Figure before zooming when the gnuplot toolkit is used

Figure after zooming when the gnuplot toolkit is used
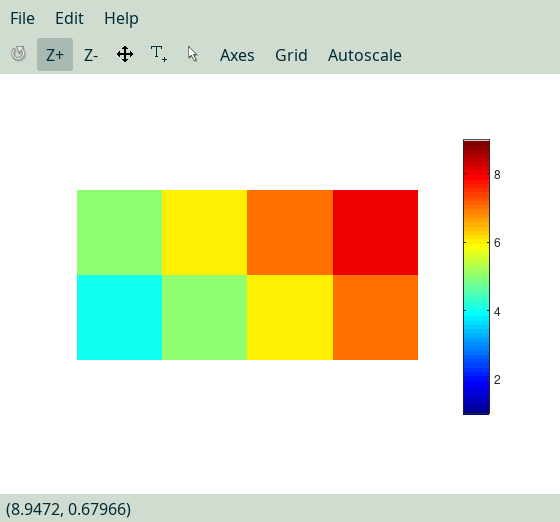
Therefore, the modern qt is a better choice than gnuplot, which has no such problem at all.

Figure after zooming when the qt toolkit is used
However, because I usually start an Octave session from within Emacs by executing the run-octave command, a created figure window cannot be closed via either mouse clicking or key pressing Ctrl+w, while it is normal when Octave is started from a console.
Previously , I thought this was a bug in Octave’s graphics system. According to this answer, it is caused by an inappropriate command line argument --no-line-editing adopted by Emacs in the variable inferior-octave-startup-args. Then the solution is to customize this variable with the value ("-i" "--line-editing" "--silent").